
What is bias and variance in machine learning?
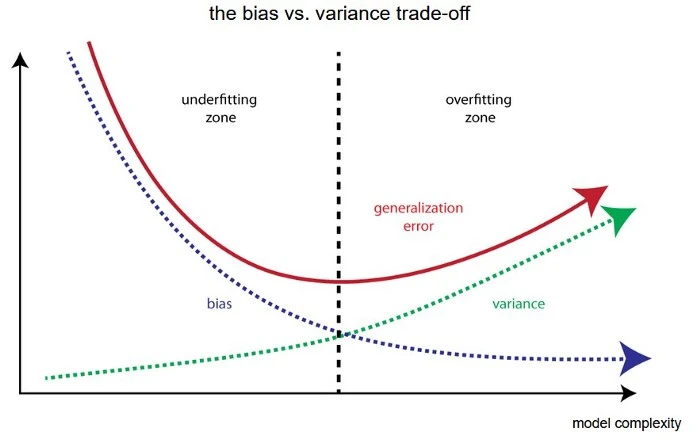
Quick summary
- High bias misses useful patterns: an overly simple model can make systematic prediction errors.
- High variance follows noise: predictions can change sharply when the training data changes.
- Compare training and test behaviour: underfitting and overfitting show different error patterns.
- Aim for generalisation: learning the training set well is not enough if performance fails on unseen data.
- Some models are too simplistic and ignore important relationships in the training data, which could have improved their predictions. Such models are said to have high bias. When a model has high bias, its predictions are consistently off, at least for certain regions of the data if not the whole range. For example, if you try to fit a line to a scatter plot where the data appears to follow a curve-linear pattern, then you can imagine that we won’t have a good fit. Some parts of the plot, the line will fall below the curve and other parts it will be above it, awkwardly trying to follow the trajectory of a curve. Since the line traces out the model’s predictions, then we can see that when the line falls below the curve, the predictions are consistently lower than the ground truth, and vice versa. So when you think of the word bias, think of predictions being consistently off. High-bias models are said to underfit [to the training data], and as such the prediction error is high both on the training data and test data.
- Some models are too complex, and the process of looking for important relationships between our variables, they also happen to pick up on certain relationships that turn out to just the result of noise. In other words, the model takes into account certain “flukes” in the training data that don’t generalize to the test data. In such a case, the model’s predictions are once again off, but here’s the important part: they are not consistently off. Change the data a little, and we can end up with very different predictions. Why? Because the model is too sensitive and over-reacting to the change in the data. High-variance models are said to overfit [to the training data], and as such their prediction error is deceptively low on the training data, but high on the test data, hence the lack of generalization.
A concrete example of bias and variance
Imagine estimating the price of a used bicycle from its age. In this hypothetical dataset, prices drop quickly during the first few years and then level out. A straight line may struggle to describe both parts of that pattern. Its predictions can be systematically too high in one region and too low in another, even when the training data contains many examples.
Now imagine fitting an extremely flexible curve through every observation. That curve may follow unusual prices caused by damage, accessories or recording errors. Replace a few bicycles in the training sample and the fitted curve could change considerably. The issue is its sensitivity to the particular sample, rather than a consistently wrong prediction in one direction.
Neither example proves that straight lines are always poor models or flexible models are always unreliable. Suitability depends on the relationship, the available information and the training procedure. A simple model can perform well when its assumptions fit the task. A complex model can generalise well with suitable data and constraints.
Use error patterns as clues
Start by comparing training performance with validation performance using the same metric. High error on both suggests that the current setup cannot capture enough useful structure. Investigate the features and training process as well as the model. An incorrectly prepared target or an optimisation problem can resemble underfitting, so changing the algorithm immediately may miss the cause.
A large gap between low training error and higher validation error suggests poor generalisation. However, it is not a direct measurement of variance. The validation data may come from a different period or population. Examine whether the split represents the circumstances in which the model will actually run before deciding that excessive complexity explains everything.
For example, predicting next month’s demand using a random mixture of past and future records creates a misleading experiment. A chronological split asks a more relevant question. Similarly, placing repeated records from the same customer in both training and validation can make performance appear stronger than it is for genuinely new customers.
Choose a targeted improvement
When the model misses a clear relationship, try a relevant feature, a less restrictive model or weaker regularisation. Change one important factor at a time and record the result. If the model follows noise, investigate stronger regularisation, a simpler representation or more representative training examples. Removing every unusual observation is not automatically helpful because some rare cases are real and important.
Ensembling can also change the balance. The scikit-learn comparison of a single tree and bagging shows how averaging fitted estimators can reduce prediction variability in a controlled example. That does not remove the need to evaluate the combined model on the task at hand.
Keep an untouched test set for the final assessment after choosing features and settings. Record error by meaningful subgroup or input range, because a reasonable average can conceal a weak region. The relationship between bias, variance and test set MSE provides the mathematical counterpart to this intuition.
Finally, distinguish statistical bias from social bias. Here, bias concerns the average prediction relative to a target relationship. Fairness concerns may involve representation, measurement choices and unequal consequences. A model with low prediction error can still behave poorly for a particular group, so these questions need their own checks.
The post What is bias and variance in machine learning? appeared first on Alpesh Kumar.